반응형
Table of Contents
- Linear Regression
- What is Linear Regression?
- When do we use Linear Regression?
- Python
- Packages for Linear Regression
- Simple Linear Regression
Linear Regression
What is Linear Regression?
Linear regression is a mathematical algorithm which is commonly used for data analysis. In Linear Regression, there are two types of variable ( dependent variable & independent variables ).
Mock Dataset
| Age | Gender | Genre |
| 20 | One | HipHop |
| 23 | 0 | Classsical |
| 25 | 0 | Jazz |
| 26 | One | Jazz |
According to this data, age and gender are classified as independent variables and genre is an dependent variable.
Python
Package for Linear Regression
 # required libraries
 import numpy as np
   import pandas as pd
   import matplotlib.pyplot as plt
Pandas is a Python library used for working with data sets and Matplotlib is a library used for visualization.
Dataset: https://www.kaggle.com/datasets/peterkmutua/student-hours-scores
 # get data from local
 data = pd.read_csv( 'score.csv' )


 # plotting actual data points
 plt.scatter(hours, scores, color= "m" , marker= "o" , s= 30 )
 plt.show()
result:

Finding coefficient
def   find_coefficient  (x, y) :
    observation_count = np.size(x)
    mean_of_x = np. mean
    mean_of_y = np. mean

    # calculating cross-deviation and deviation about x
    SS_xy = np.sum(y * x) - observation_count * mean_of_y * mean_of_x
    SS_xx = np.sum(x * x) - observation_count * mean_of_x * mean_of_x

    # calculating regression coefficients
    b_1 = SS_xy / SS_xx
    b_0 = mean_of_y - b_1 * mean_of_x

    return b_0, b_1
Full Code
import numpy as np
import matplotlib.pyplot as plt
import pandas as pd
def find_coefficient (x, y) :
observation_count = np.size(x)
mean_of_x = np.mean(x)
mean_of_y = np. mean(y)
# calculating cross-deviation and deviation about x
SS_xy = np.sum(y * x) - observation_count * mean_of_y * mean_of_x
SS_xx = np.sum(x * x) - observation_count * mean_of_x * mean_of_x
# calculating regression coefficients
b_1 = SS_xy / SS_xx
b_0 = mean_of_y - b_1 * mean_of_x
return b_0, b_1
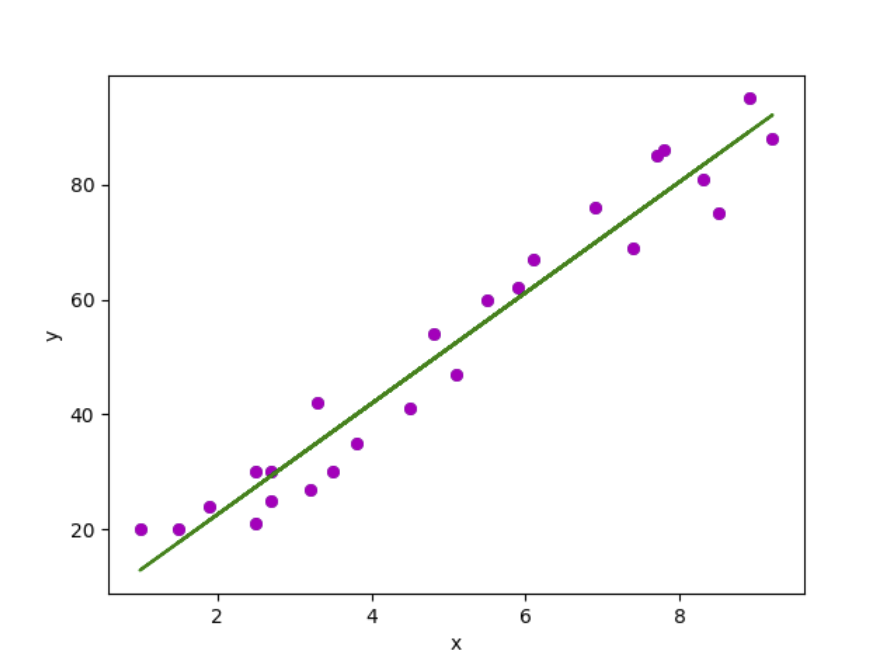
def plot_regression_line (x, y, b) :
# plotting the actual points as scatter plot
plt. scatter(x, y, color= "m" ,
marker= "o" , s= 30 )
# predicted response vector
y_pred = b[ 0 ] + b[ 1 ] * x
# plotting the regression line
plt.plot(x, y_pred, color= "g" )
# putting labels
plt. xlabel( 'x' )
plt.ylabel( 'y' )
# function to show plot
plt.show()
def main () :
data = pd.read_csv( 'score.csv' )
hours = data[ 'hours' ]
scores = data[ 'score' ]
co_efficient = find_coefficient(hours, scores)
plot_regression_line(hours, scores, co_efficient)
if __name__ == "__main__" :
main()
Result:
반응형
'Programming > Python' 카테고리의 다른 글
| Linear Regression with Scikit-Learn or Sklearn (0) | 2023.07.24 |
|---|
